Posted in Percentage, Primary Five

Percentage

Before I taught Percentage, I gave students the following problem to solve:

Ethan’s scores for WA1 are shown below:

English: 44/50

Mathematics: 34/40

Mother Tongue: 15/20

Science: 48/60

In which subject did he perform the best?

Students were given some time to think and were assured that there were more than one possible way of arriving at the answer. The following methods were mentioned:

There are certainly other ways of determining the best subject, but due to lack of time, I settled on these three. I asked students which method they liked the least and they said Method 1 because the numbers were large and it took more time to calculate. They liked Method 2 as 100 seemed like a nice base for comparison. I then introduced to them that “out of 100” is the concept of percent. I drew their attention to Method 3 and they saw that the numbers in Method 2 and 3 were related. For example, English was 88/100 as well as 0.88. This showed them that percentage, fractions and decimals were related.

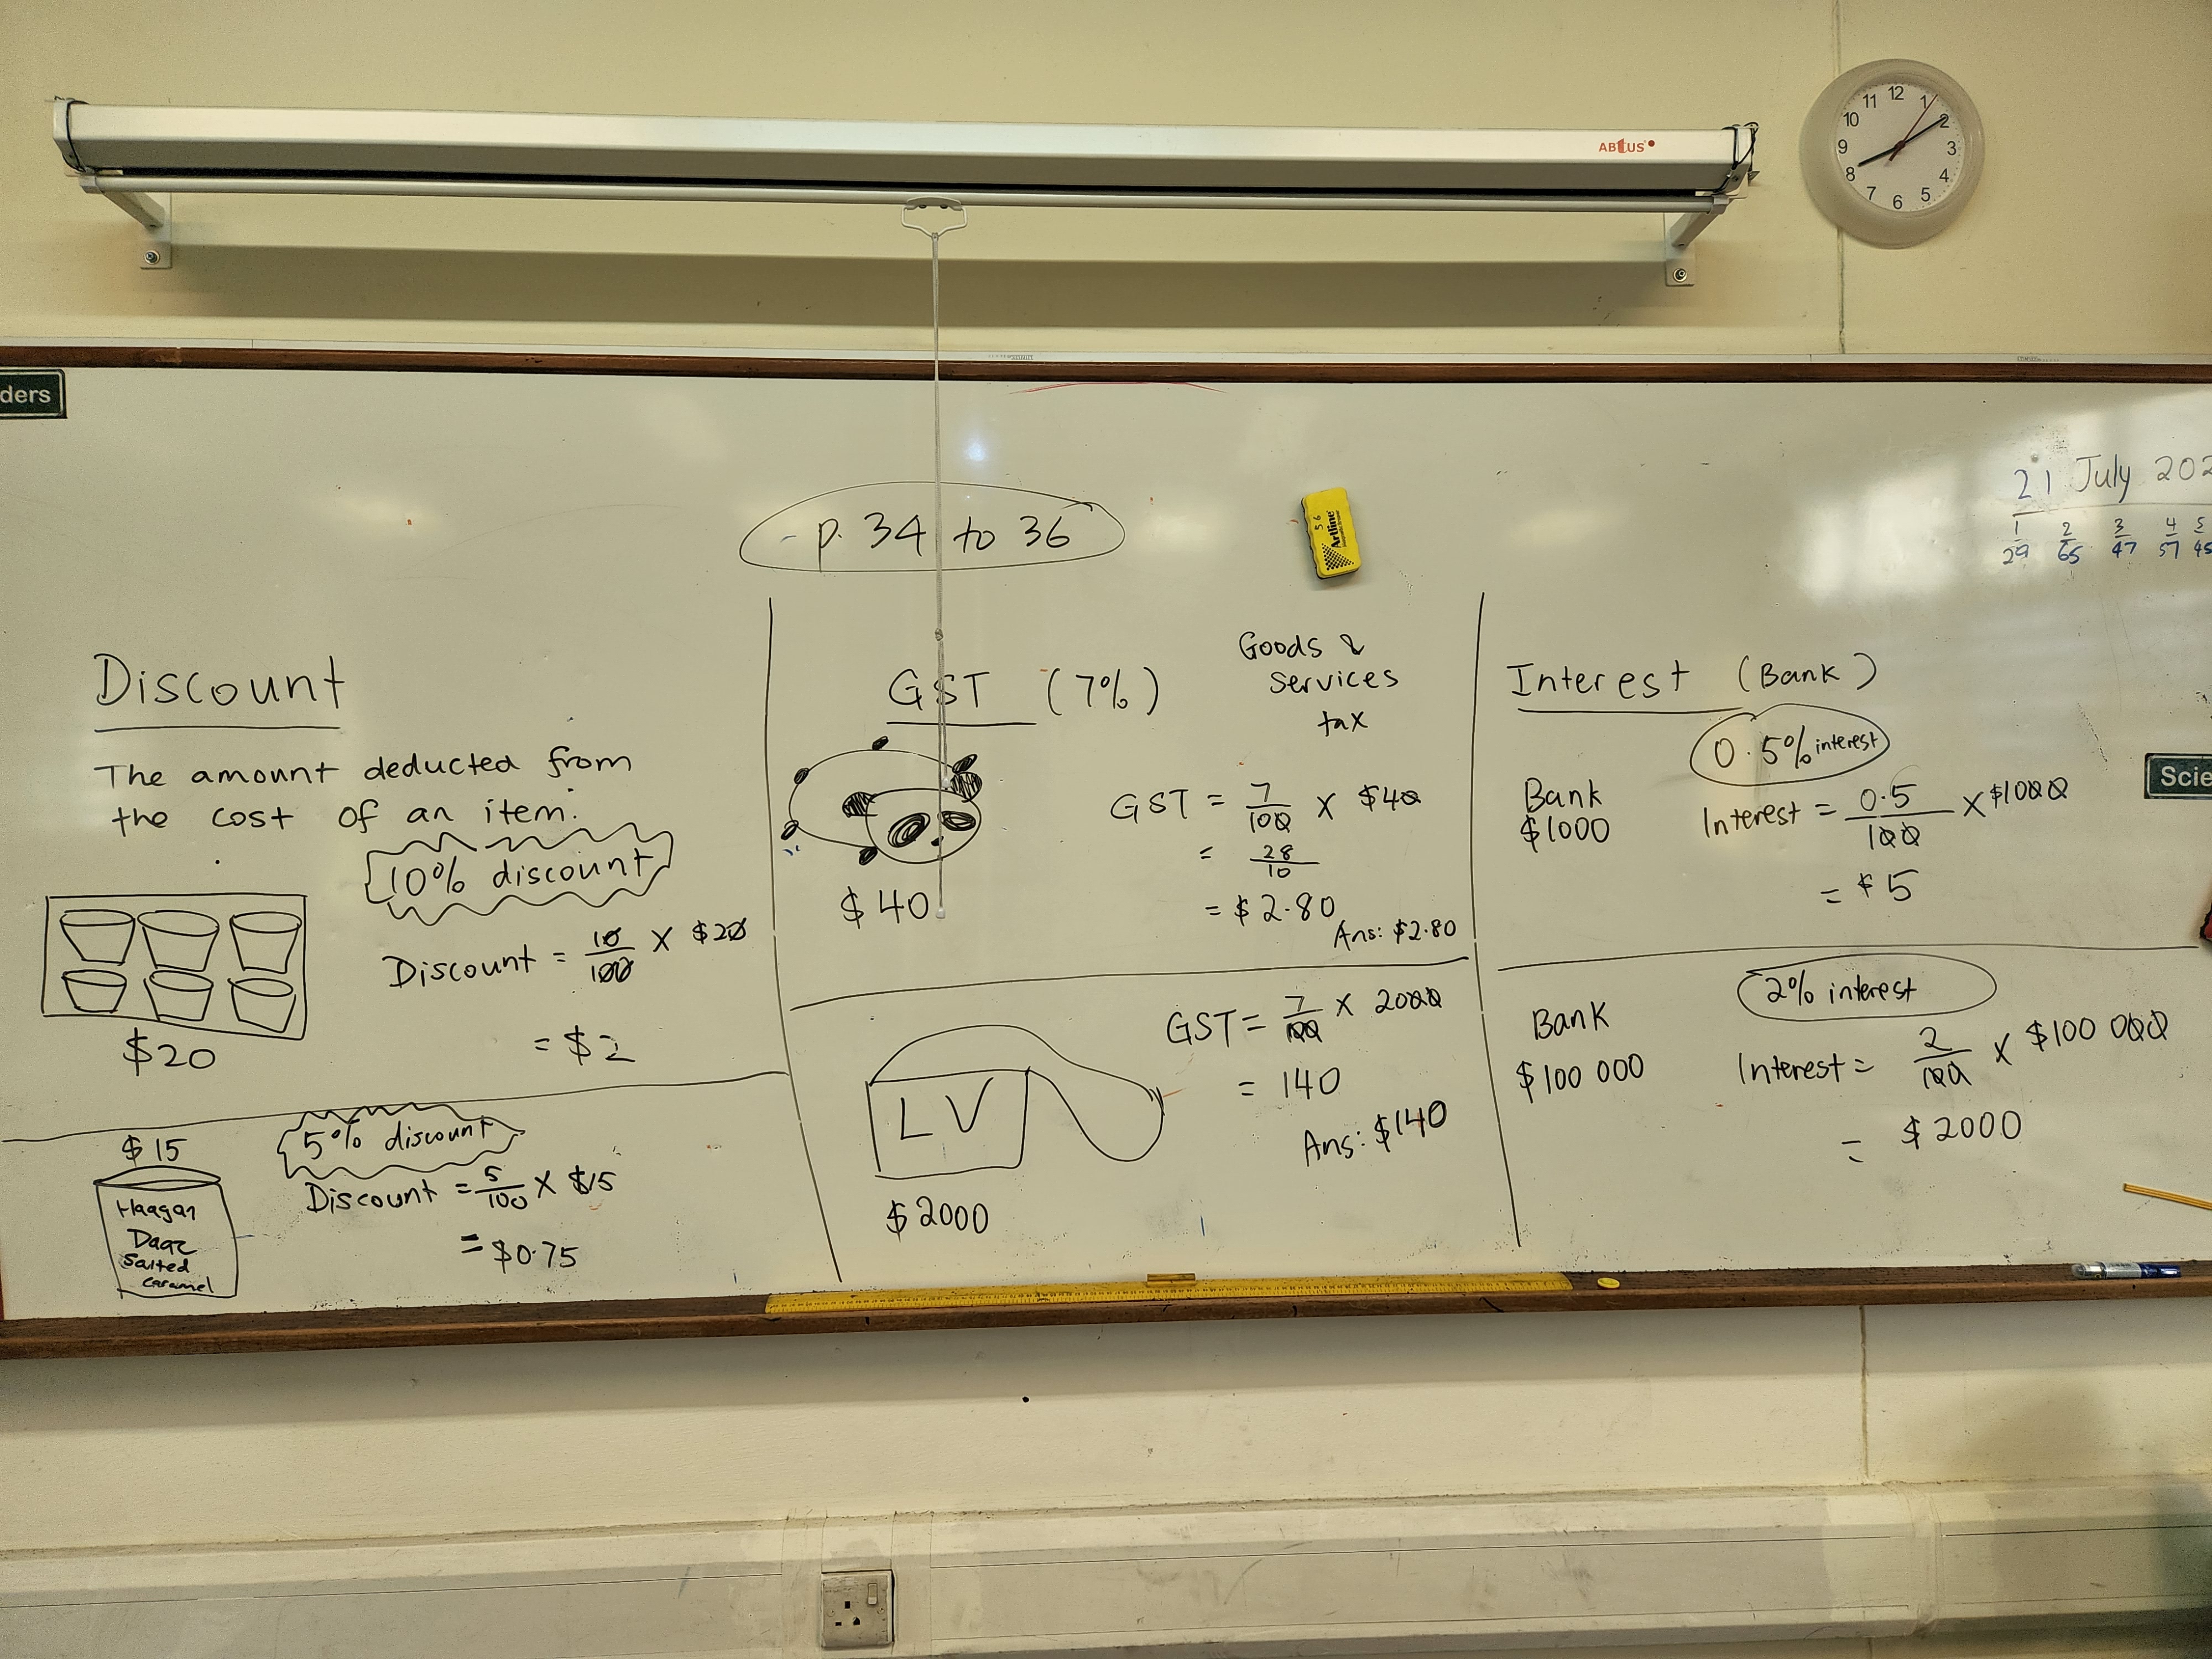
In a later lesson, we discussed the calculation of discounts, GST and interest. We discussed these concepts in real life.

Posted in Primary Three, Statistics

Bar Graphs

For this topic, I conducted a survey on favourite subjects and got students to paste sticky paper in the column representing their favourite subject as shown below:

I outlined the resultant bars and showed students that the sticky paper could be removed and the information could be represented by bars. I also introduced them to the title of the bar graph, the horizontal and vertical axes and the scale.

Students were placed in groups of 5 or 6 and had to decide on a survey to conduct. Each group was given some time to gather the results and plotted bar graphs. The group below wanted to find out which places in Singapore were popular. They found that USS was the most popular while the Merlion Park was the least popular place of attraction among their classmates.

Other surveys were done on favourite animals, favourite candies, favourite fruits and favourite colours.

I also used one of the data sets and demonstrated how Excel could quickly generate a bar graph.

Posted in Fractions, Numbers, Primary Three

Comparing fractions

I revised with students the comparison of unit fractions as well as like fractions. They had learnt to compare such fractions in Primary 2. Then, I asked students to compare 1/2 and 3/4.

A few volunteers attempted to explain. The following methods were brought up:

(1) The first volunteer drew diagrams showing 1/2 and 3/4. She said that 3/4 was greater than than 1/2 by a quarter.

(2) Another student showed with diagrams that 1/2 is equal to 2/4. I related this to what students have learnt about equivalent fractions. I reminded students that they could make the denominators the same such that the fractions became like fractions and they have learnt the comparison of like fractions in Primary 2.

(3) One other student mentioned making the numerators the same. In this case, 1/2 = 3/6. 3/6 is smaller than 3/4 since 1/6 is smaller than 1/4. I also explained that when the same amount is shared among 6 people, each person gets a smaller share than when the same amount is shared among 4 people.

(4) A mathematically inclined student said that when 1/2 is subtracted from one whole, 1/2 is left. When 3/4 is subtracted from one whole, 1/4 is left. Since 1/4 is smaller than 1/2, 3/4 must be greater than 1/2. She compared the remainders! That was sophisticated thinking!

(5) Finally, when there were no other responses, I told students that when comparing with 1/2, they needed to find what half of the total number of parts was. To find out if 3/4 was greater or smaller than 1/2, find half of 4 (which is 2). Since 3 is greater than 4, 3/4 is greater than 1/2.

I was glad with the rich discussion that ensued, although it was also evident that some students were not able to follow the discussion. For those students, I would be providing fraction strips / circles to help them visualise for subsequent lessons.

Students did their workbook on comparing fractions, with the instruction that they needed to explain their answers, since there was a 50% of getting each question correct! Below are some examples of students’ work:

I will also take the opportunity to explain that 3/4 × 5 is different from (3×5)/(4×5) as some students made that error.

Posted in Fractions, Numbers, Primary Three

Equivalent fractions

This is the second time I am teaching equivalent fractions to Primary 3 students.

As before, I got students to fold strips and to discover that 1/2 = 2/4 = 4/8.

This time, I also used number lines to show equivalent fractions. Metre rulers were used to represent number lines so students can see the markings on the rulers and be more exact in demarcating the various fractions.

Students watched a YouTube video by Mrs T Allen-Stokes and figured out how to distribute 15 gold bars equally between 2 people using the concept of equivalent fractions. I was delighted that students came up with different solutions.

They also read a story where the magic words were “What you do to the top, you do to the bottom”. These magic words were catchy and they could memorise them in no time.

The story inspired a conscientious student to create her own fractions stories:

Mathematics is fun. 🙂